Discovering Household Travel Data Stories Through Collaboration
Originally published on Sound Data Stories, PSRC’s data blog, March 2021.
In 2020 when we were all starting to work at home, the PSRC data team formed a working group to learn from each other how Household Travel Survey Data could be used to inform urban planning policy. We used the COVID-19 period to grow our skills in working with household travel survey data.
Thank you to Abdi Mohamud, Brian Lee, Christy Lam, Drew Hanson, Grant Gibson, Neil Kilgren, Polina Butrina, and Mary Richards who shared their brains and time in this effort.
Upskilling Before Discovering
We made many exciting data discoveries during the past year, but before we could really dive in, we needed to increase our statistics and scripting skills for working with survey data.
We did statistics, learning how to apply sample weights and calculate margins of error.
We wrote functions to easily summarize the data and collaborated via GitHub. Here’s an example of a shared function:
categorical_moe <- function(sample_size_group){
  sample_w_MOE <- sample_size_group %>%
    mutate(p_col = p_MOE) %>%
    mutate(MOE_calc1 = (p_col*(1-p_col))/sample_size) %>%
    mutate(MOE_Percent = z*sqrt(MOE_calc1))
  sample_w_MOE <- select(sample_w_MOE, -c(p_col, MOE_calc1))
  return(sample_w_MOE)
}
Data Discoveries

Residential Displacement
A new question asked on the 2019 survey was why people moved from their previous homes. We discovered that:
- About a quarter of households that moved in the past five years reported that they relocated for one or more negative reasons: cost of housing, forced to move, change in income, or loss of community. Cost of housing was by far the top reason.
- One in five white households (22%) felt pressured to leave their homes, as did 14% of Asian households. But nearly one in three (30%) Other People of Color households moved elsewhere because they had to.
- Displacement is truly a regional phenomenon: across the region and its counties, displacement was reported at statistically the same rate.
More on this in blog posts about our displacement findings. The Seattle Times also covered it.
Understanding Travel by Different Racial Groups
Racial equity is a key part of PSRC’s planning efforts. We had to figure out how to balance adequate sample sizes with richness of detail about people’s race.
We reported that “Other People of Color were the most likely to take transit to work (17%), followed by Asians (11%) and whites (9%).” We also analyzed African American travel separately, finding that African American people were much more likely to live in a household with no cars than non-Hispanic Whites (around 1 in 5 vs. 1 in 20).
A puzzle we encountered: how do we describe a household’s race? Not only are people multi-racial, but households are also multi-racial. Residential and vehicle ownership choices are made at the household level. Our approach assigned households to racial categories based on the composition of adults.
Telework Patterns
Pre-COVID telework data from the 2019 survey showed:
- 10% of workers teleworked 6–12 hours a day; 14% less than six hours but more than zero.
- People who teleworked part-time traveled 10% fewer miles by car; full-time teleworkers traveled 34% less distance.
- The number of trips people who teleworked made was similar to non-teleworkers; they had shorter trips, which is why car distance is reduced. People substituted non-work trips for work trips.
- For households with income of $150,000+, the odds of teleworking were 30% higher than other income categories.
- Hispanic and Asian workers were 20–30% more likely to telework than whites. African American workers were 25% less likely to telework than whites.
Home Deliveries
In 2019, home deliveries were common and increasing. One out of three households received a package on an average weekday.
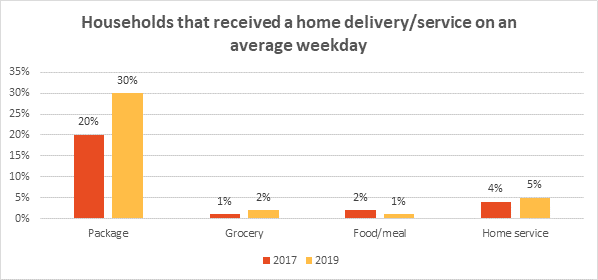

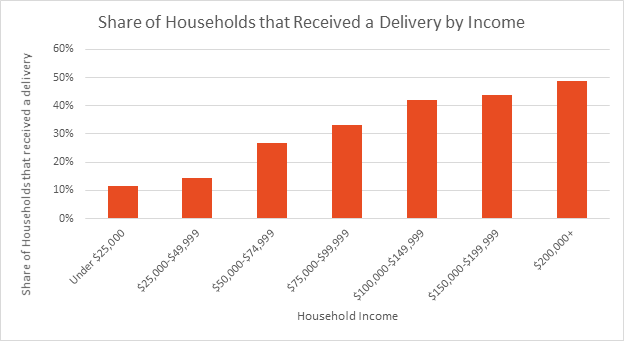
High-income households received many more deliveries than low-income ones. The Seattle Times also covered the delivery data.
New Mobility
From 2017 to 2019, the share of regional adults who had ever used a ride-hailing service went up from 24% to 35%. Over half of Seattle adults had used ride-hailing by 2019.
Around 73% of ride-hailing and carsharing users commuted by walking/biking, carpool, or transit, compared to more than 70% of regional workers using a single-occupancy vehicle.
Commuting Behavior
Trips to or from work are only 24% of all weekday trips. Workers with incomes under $10,000 have commutes of around 14 minutes, whereas workers with incomes from $50,000–$74,999 have commutes around 27 minutes. The average travel time to work is about the same for workers in households with incomes greater than $75,000, around 33 minutes.
Model Estimation
After a while, looking at data on one or two dimensions doesn’t tell the whole story. We estimated models to find what factors are driving behaviors. Some of the code is on GitHub.

The models asked:
- Do people who telework on a given day travel less? (Yes)
- Do people who live in places with pro-growth policies experience less residential displacement? (Yes)
- Do people who get home deliveries make fewer shopping trips on an average weekday? (Not that we could observe)
- Does transit access correlate with lower household vehicle ownership, controlling for income, household size, etc.? (Yes, definitely)
Let’s Do This Again Sometime
I hope we can form more working groups to build pathways from raw data through statistics to urban planning meaning. Data people tend to be introverts and often want to stay in their data corner by themselves. But when we work together our code improves, our statistical analysis has more rigor, and we are more useful to the planning process.